This topic contains 1 reply, has 2 voices, and was last updated by ![]()
![]() Tyrober 11 years, 6 months ago.
Tyrober 11 years, 6 months ago.
- AuthorPosts
- Posted on: Mon, 10/08/2012 - 12:22pm #43710
- Posted on: Tue, 10/09/2012 - 3:33am #719462


TyroberParticipantWith ESPN.com’s 2012 #NBARank feature concluded, we take our second annual look at how players’ rankings compare to their earnings. As described in last year’s analysis the league’s system is built upon player salaries — for example each team must adhere to the league’s salary-cap rules, and trades must conform to strict requirements controlling the salaries of the traded players.
As a result of several new rules added to the league’s collective bargaining agreement, getting enough bang for the buck is now more important than ever. Teams that spend beyond a certain threshold are now penalized in the form of restricted access to salary-cap exceptions such as the midlevel and biannual.
Starting next season teams above this threshold (set at $4 million above the league’s luxury-tax line) also will not be able to receive a player in a sign-and-trade transaction, which has long been an essential tool for GMs of capped-out teams to add talent.
And it gets worse. The luxury tax, which has always been a dollar-for-dollar penalty for payrolls that exceed the tax line, becomes progressive — with the penalty increasing in 2013-14 to $1.50 for every dollar. But that’s just for the first $5 million over the tax line. For each additional $5 million, the penalty becomes progressively worse, increasing to $1.75 for every dollar between $5 million and $10 million, then $2.50, $3.25 and so on.
As these penalties become stifling and potentially crippling, the onus is on smart general managers to sign players whose talents are in line with their salaries. The #NBARank data lets us define what this means. By plotting each player’s #NBARank score against his salary, a clear pattern emerges.
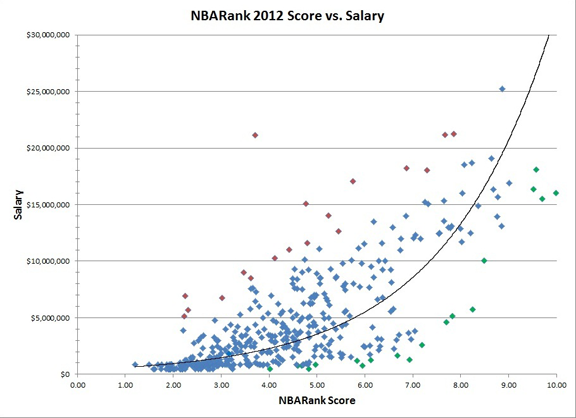 Larry CoonGraph of NBARank scores against players’ salaries.
Each dot in the chart represents a specific player (for example, the rightmost dot is LeBron James and the topmost dot is Kobe Bryant). The line through the chart is called a regression or a trend line — it represents the expected salary for each #NBARank score.
For example, a player with an #NBARank score of 5.0 would have an expected salary of $3,542,062, and a player with an NBARank score of 8.0 would have an expected salary of $13,310,256.
As you would expect, the better players tend to be better compensated. In fact, the curve is exponential — so the stars don’t just get paid more than the rank-and-file players, they get paid a lot more. Here is the average value of a one-point gain at every level:
Gettin’ paid
From NBARank score To NBARank score Expected raise 1 2 $336,410 2 3 $522,974 3 4 $813,000 4 5 $1,263,866 5 6 $1,964,771 6 7 $3,054,377 7 8 $4,748,247 8 9 $7,381,490 9 10 $11,475,055 By computing a player’s actual salary against his expected salary based on his #NBARank score, you can determine whether he is underpaid or overpaid for what he delivers on the court. Fortunately, most players’ salaries are commensurate with their performance — in other words their points on the graph are fairly close to the trend line.
But there are a few outliers — players whose salaries are nowhere near what you would expect them to be. The farther a dot is above the trend line, the more overpaid the player; and conversely, the farther below the trend line, the more underpaid (but a better bargain for the team).
Before identifying the most overpaid and underpaid players, it’s time to go over a few notes:
• The X axis on the graph is based on each player’s NBARank score (from 1-10) rather than his #NBARank ranking (from 1-500). I used the #NBARank results for last year’s analysis, but found that the score produced better results — the ranking forces an even separation, but the score allows clustering which more closely models real life.
• All salaries are based on the 2011-12 season. One reason for doing this is that #NBARank scores are generally based on past performance, and the rankings for rookies are largely speculative. Another is that many players are still unsigned for 2012-13. Consequently, this analysis does not include players who have never played in the NBA.
• I used 2012-13 salaries for players who have returned to the NBA after missing the 2011-12 season. This applied to Aaron Brooks, Jeff Green, Andrei Kirilenko and Brandon Roy.
• For players on minimum salary contracts with more than two years in the league, I used the minimum salary for a two-year veteran. This reflects the salary actually paid by the team (the league picks up the remainder).
• For players who signed for a partial season in 2011-12, I used the player’s full (not pro-rated) salary.
• For players who signed an extension to their rookie contract prior to the 2011-12 season, I used the player’s average salary for 2011-12 and all seasons of the extension. This is called the "poison pill" value, which is also used for salary matching when such a player is traded before his extension takes effect. This applied to Danilo Gallinari, Kosta Koufos,Kevin Love, Derrick Rose and Russell Westbrook.
• The standard "Kobe Bryant" disclaimer: This analysis reflects each player’s expected salary on the basis of his performance on the court (as determined by ESPN’s team of NBA analysts), but there are myriad other factors that determine a player’s "value," and therefore his salary. By putting fans in seats, gluing eyes to TV screens and inspiring fans to buy merchandise, the superstars are responsible for the lion’s share of NBA revenues, and are paid accordingly. While Bryant (and a few others in the upper echelons) might be overpaid relative to their on-court performance, you can legitimately argue that these players are actually underpaid relative to the value they bring to the league. (Interestingly, Bryant himself fell off the "overpaid" list this year.)
With the caveats out of the way, here are the most overpaid and underpaid players in the league, based on the raw distance between the players’ actual and expected salaries. Draw a vertical line from a player’s plot on the graph to the trend line. The longer the line above the trend line, the more overpaid the player. The longer the line below the trend line, the more underpaid the player.
Most Overpaid (by amount)
Player NBARank Score Expected Salary Actual Salary Difference Rashard Lewis 257 3.71 $2,005,286 $21,136,631 $19,131,345 Elton Brand 84 5.75 $4,932,445 $17,059,727 $12,127,282 Antawn Jamison 156 4.77 $3,199,900 $15,076,715 $11,876,815 Amar’e Stoudemire 43 6.87 $8,084,745 $18,217,705 $10,132,960 Chris Kaman 113 5.24 $3,938,590 $14,030,000 $10,091,410 Tim Duncan 27 7.67 $11,522,440 $21,164,619 $9,642,179 Kevin Garnett 21 7.86 $12,489,650 $21,247,044 $8,757,394 Ben Gordon 154 4.80 $3,240,885 $11,600,000 $8,359,115 Emeka Okafor 100 5.45 $4,320,948 $12,642,500 $8,321,552 Joe Johnson 33 7.30 $9,765,409 $18,038,573 $8,273,164 This list is filled with players at the end of expensive, long-term contracts signed under the previous collective bargaining agreement (e.g., Lewis, Brand, Jamison), and aging stars whose performance no longer justifies their high salaries (e.g., Duncan, Garnett). Interestingly, both Duncan and Garnett took significant pay cuts when they re-signed this summer, so their salaries are once again in line with their abilities.
Most Underpaid (by amount)
Player NBARank Score Expected Salary Actual Salary Difference LeBron James 1 9.99 $32,025,194 $16,022,500 $16,002,694 Kevin Durant 2 9.70 $28,202,859 $15,506,632 $12,696,227 Chris Paul 4 9.52 $26,027,636 $16,359.805 $9,667,831 Blake Griffin 14 8.25 $14,862.405 $5,731,080 $9,131,325 Dwight Howard 3 9.58 $26,689,584 $18,091,770 $8,597,814 Kyrie Irving 22 7.83 $12,331,702 $5,144,280 $7,187,422 James Harden 26 7.70 $11,670,022 $4,604,760 $7,065,262 Serge Ibaka 41 6.93 $8,311,489 $1,288,200 $7,023,289 Roy Hibbert 35 7.19 $9,320,172 $2,588,590 $6,731,582 Rajon Rondo 12 8.49 $16,522,497 $10,045,454 $6,477,043 Seven of the 10 most underpaid players were All-Stars in 2012, including MVP LeBron James. Here we are seeing the league’s two biggest mechanisms for salary control — the rookie scale and maximum salaries — at work. For example, in an open market meritocracy, James should be making almost exactly double what he is earning from the Heat.
The most accurately-paid player, by the way, is Orlando’s Daniel Orton. His expected salary, based on his performance, was $1,105,355. He was actually paid $1,105,560 — just $205 off.
General managers must now make the most of what they have, often within strict budgetary confines. From a visceral "earning their paycheck" standpoint Luke Waltonindeed might be more overpaid at $5.68 million than Kevin Garnett at $21.2 million. However, Garnett’s higher salary took up 36.6 percent of the Celtics’ salary cap, and 30.2 percent of their room under the luxury-tax threshold. A team can easily absorb Walton’s $5.68 million salary, but Garnett’s $21.2 million is much trickier to work around.
0 - AuthorPosts
| You must be logged in to reply to this topic. | Login |